Training a Smoking Status Probabilistic Model Using Cotinine Levels in a Large Claims Database

Although smoking status is not well documented throughout various large claim databases, it remains an important confounder of epidemiological studies. Drs. Dominique Medaglio, Charles E Leonard, Alisa J Stephens Shields, and Robert Gross worked on a study together to develop a probabilistic model of smoking status using available cotinine values that could be applied to claims data. While the model was internally validated, further epidemiological research is needed to externally validate utilizing the model. To explore the full article and results, please click here.
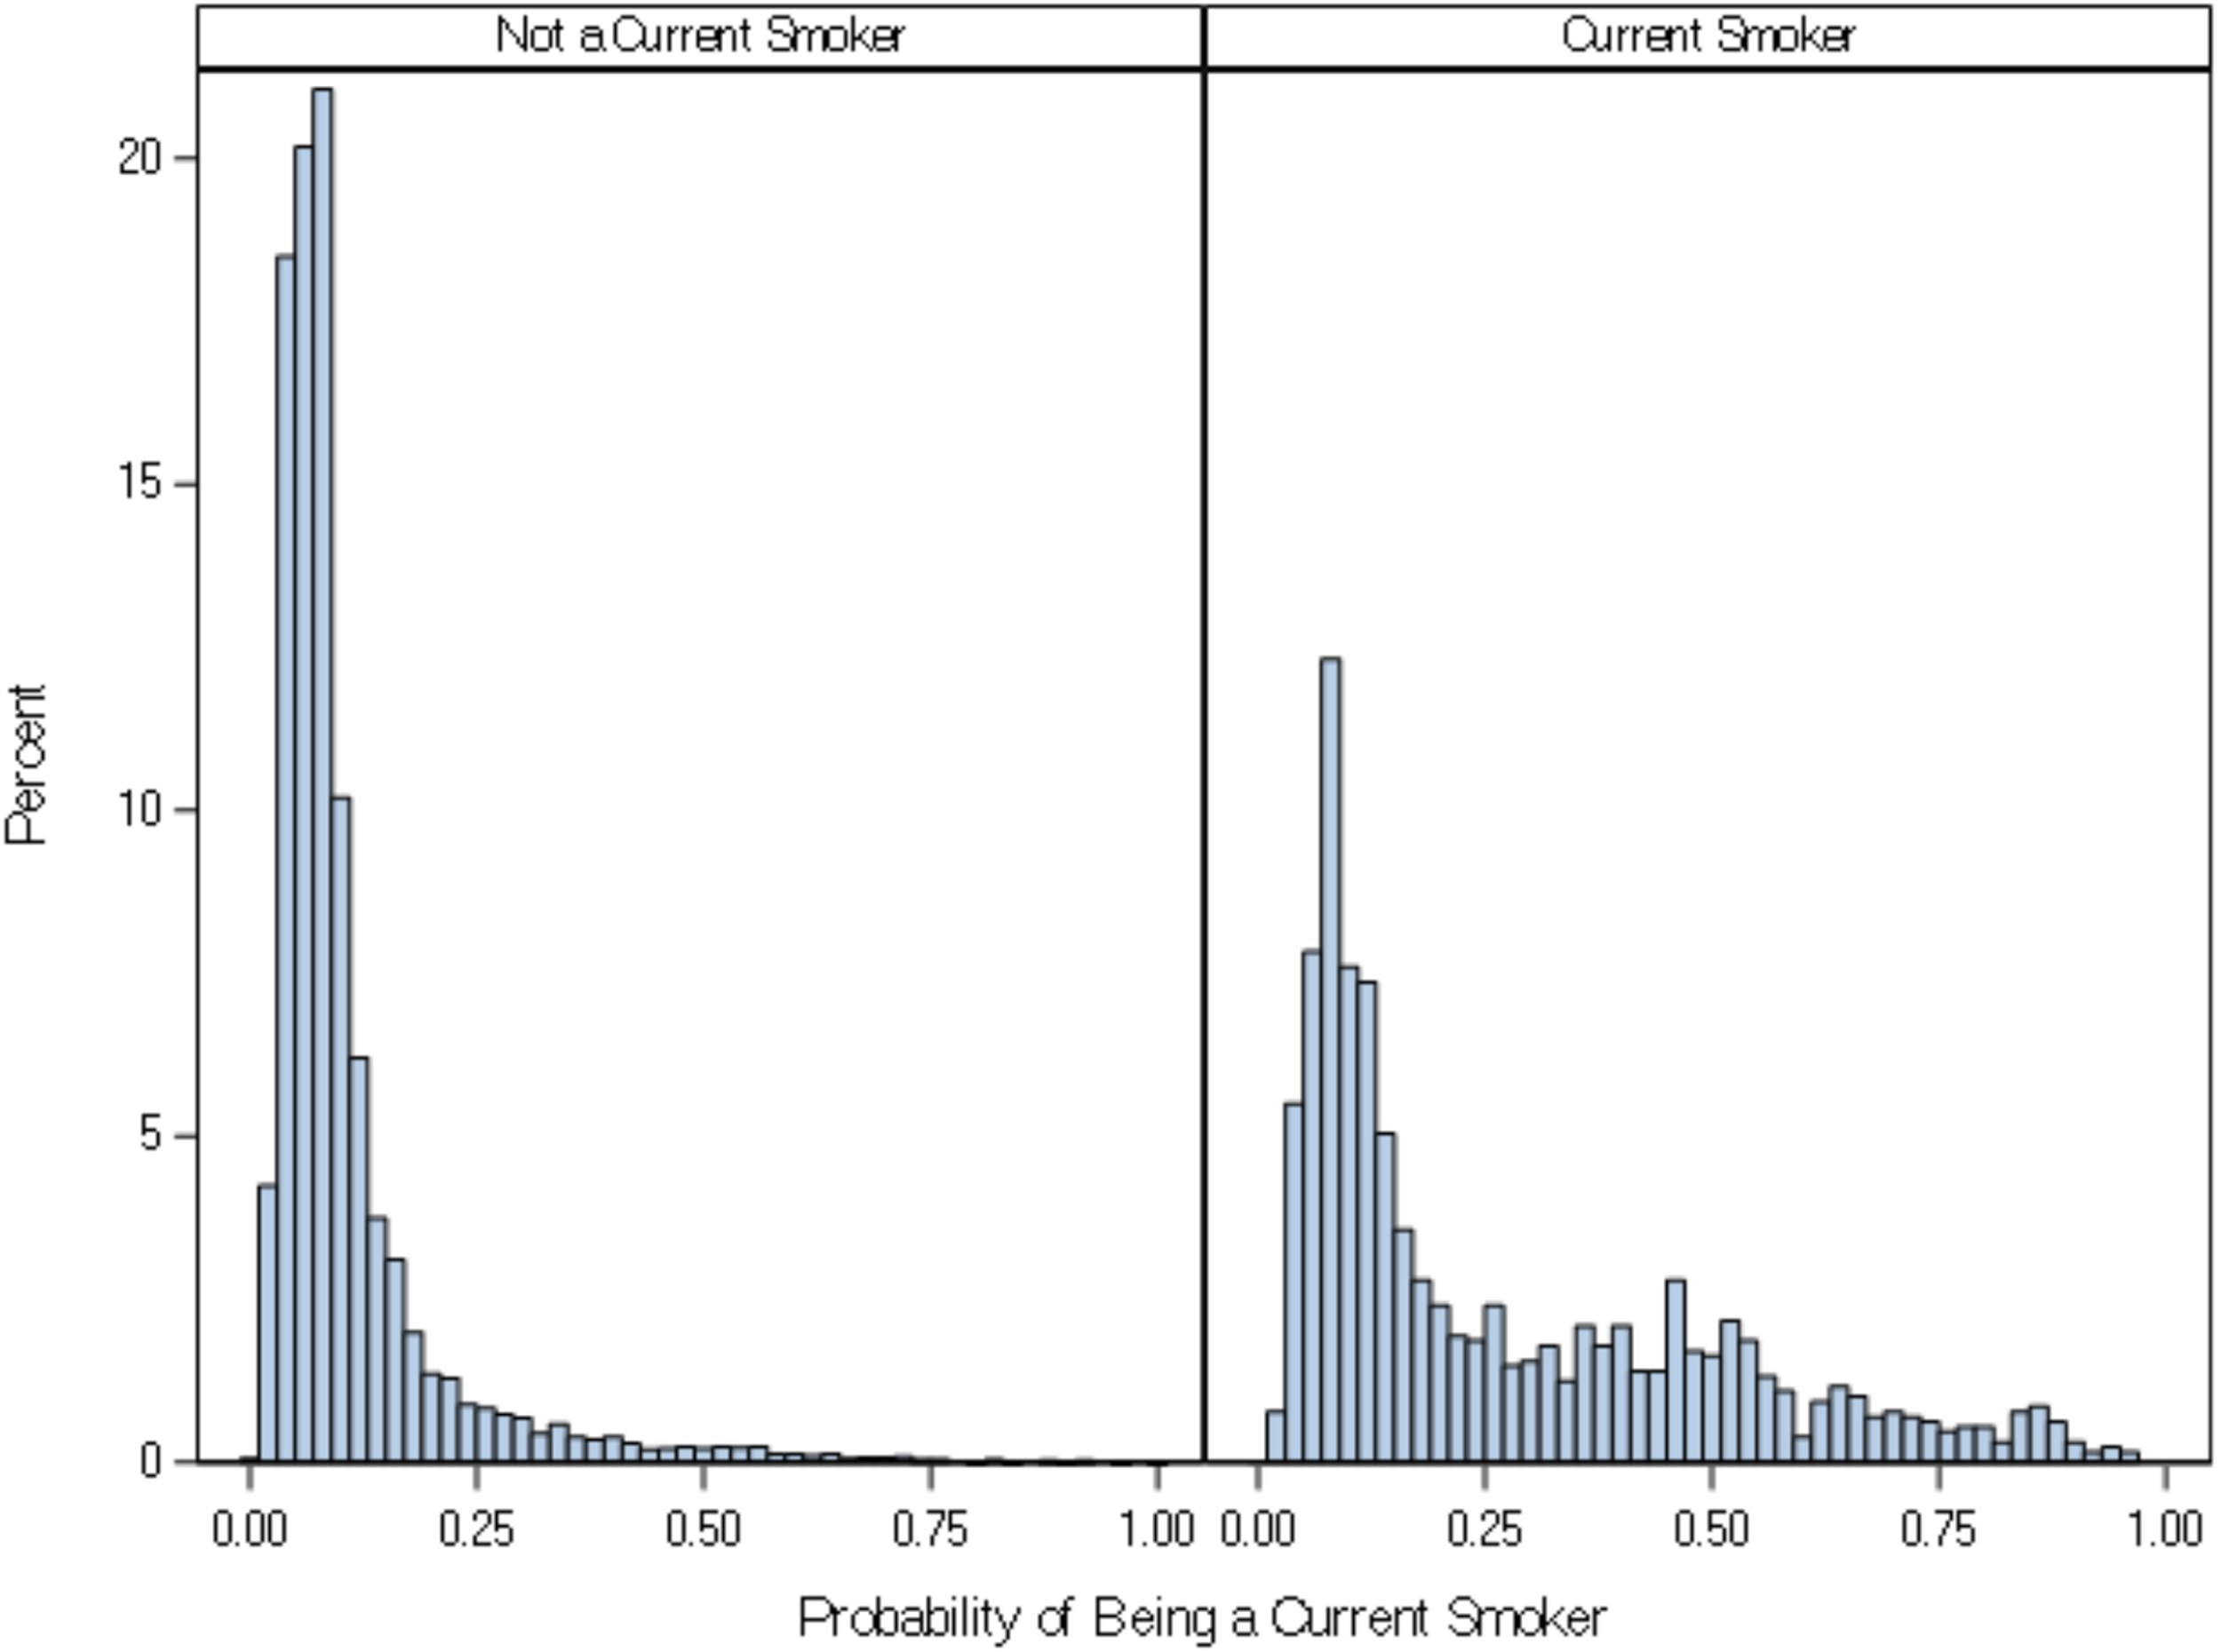
Figure 1 Histograms of predicted probabilities by smoking status.
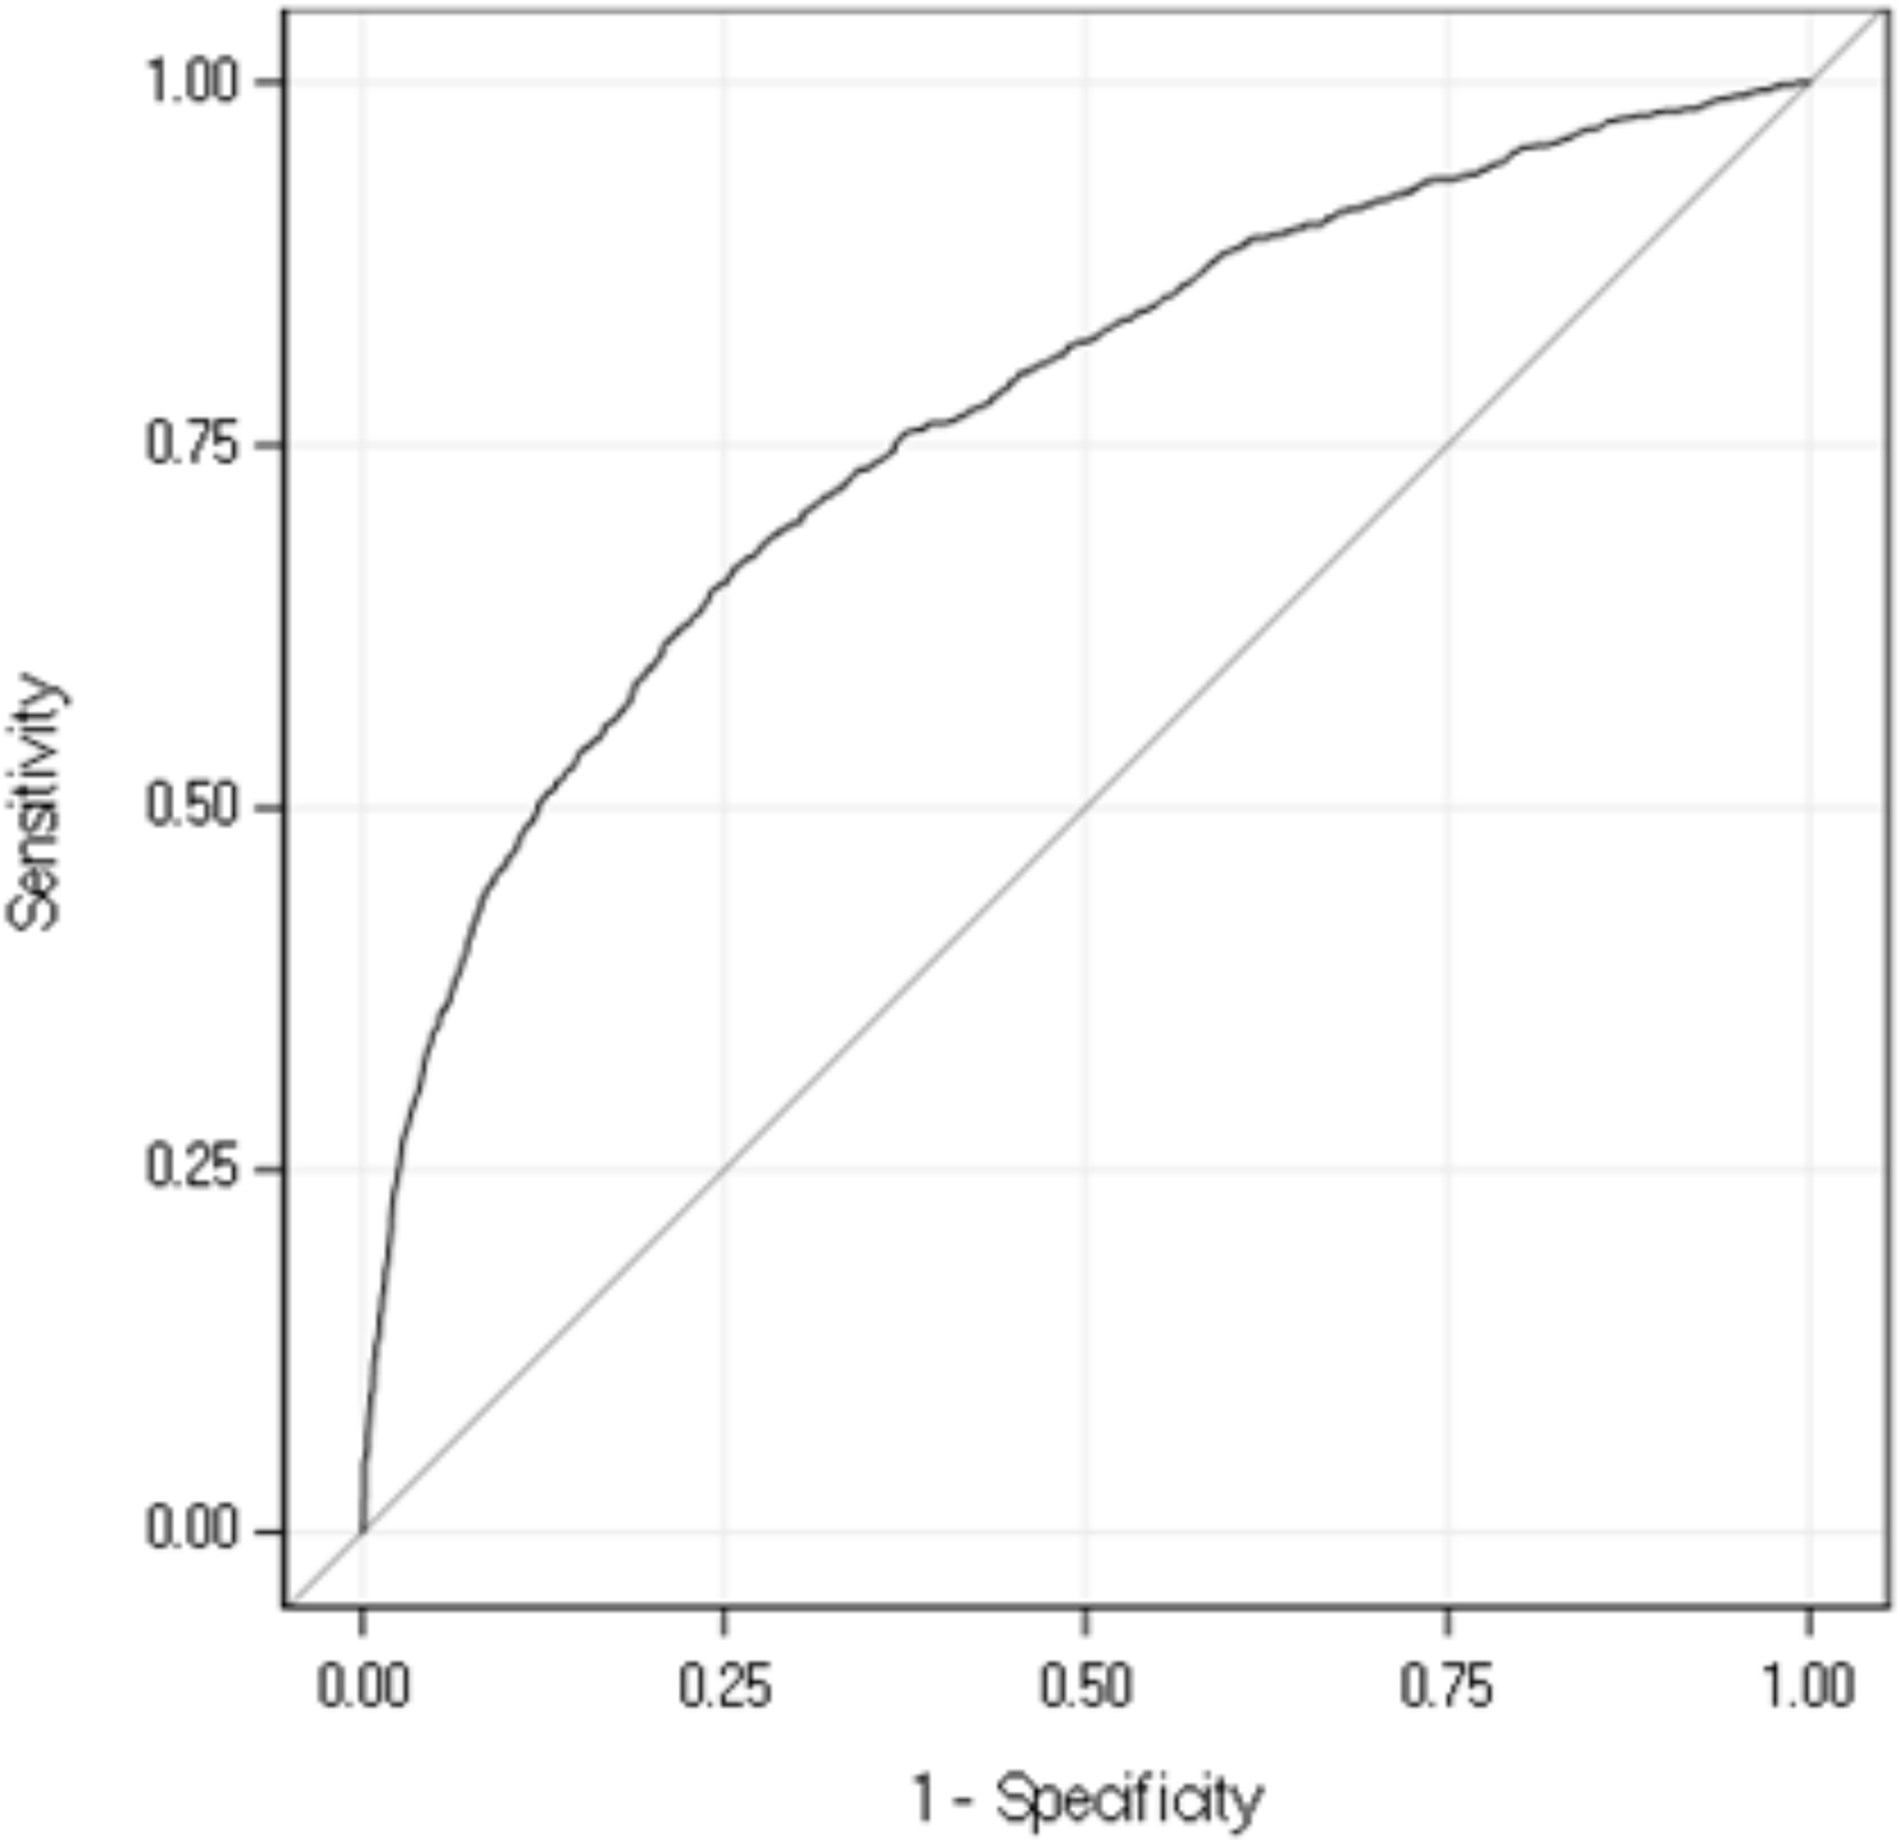
Figure 2 Discrimination plot for the test set. AUC = 0.77 (95% CI: 0.75–0.78).
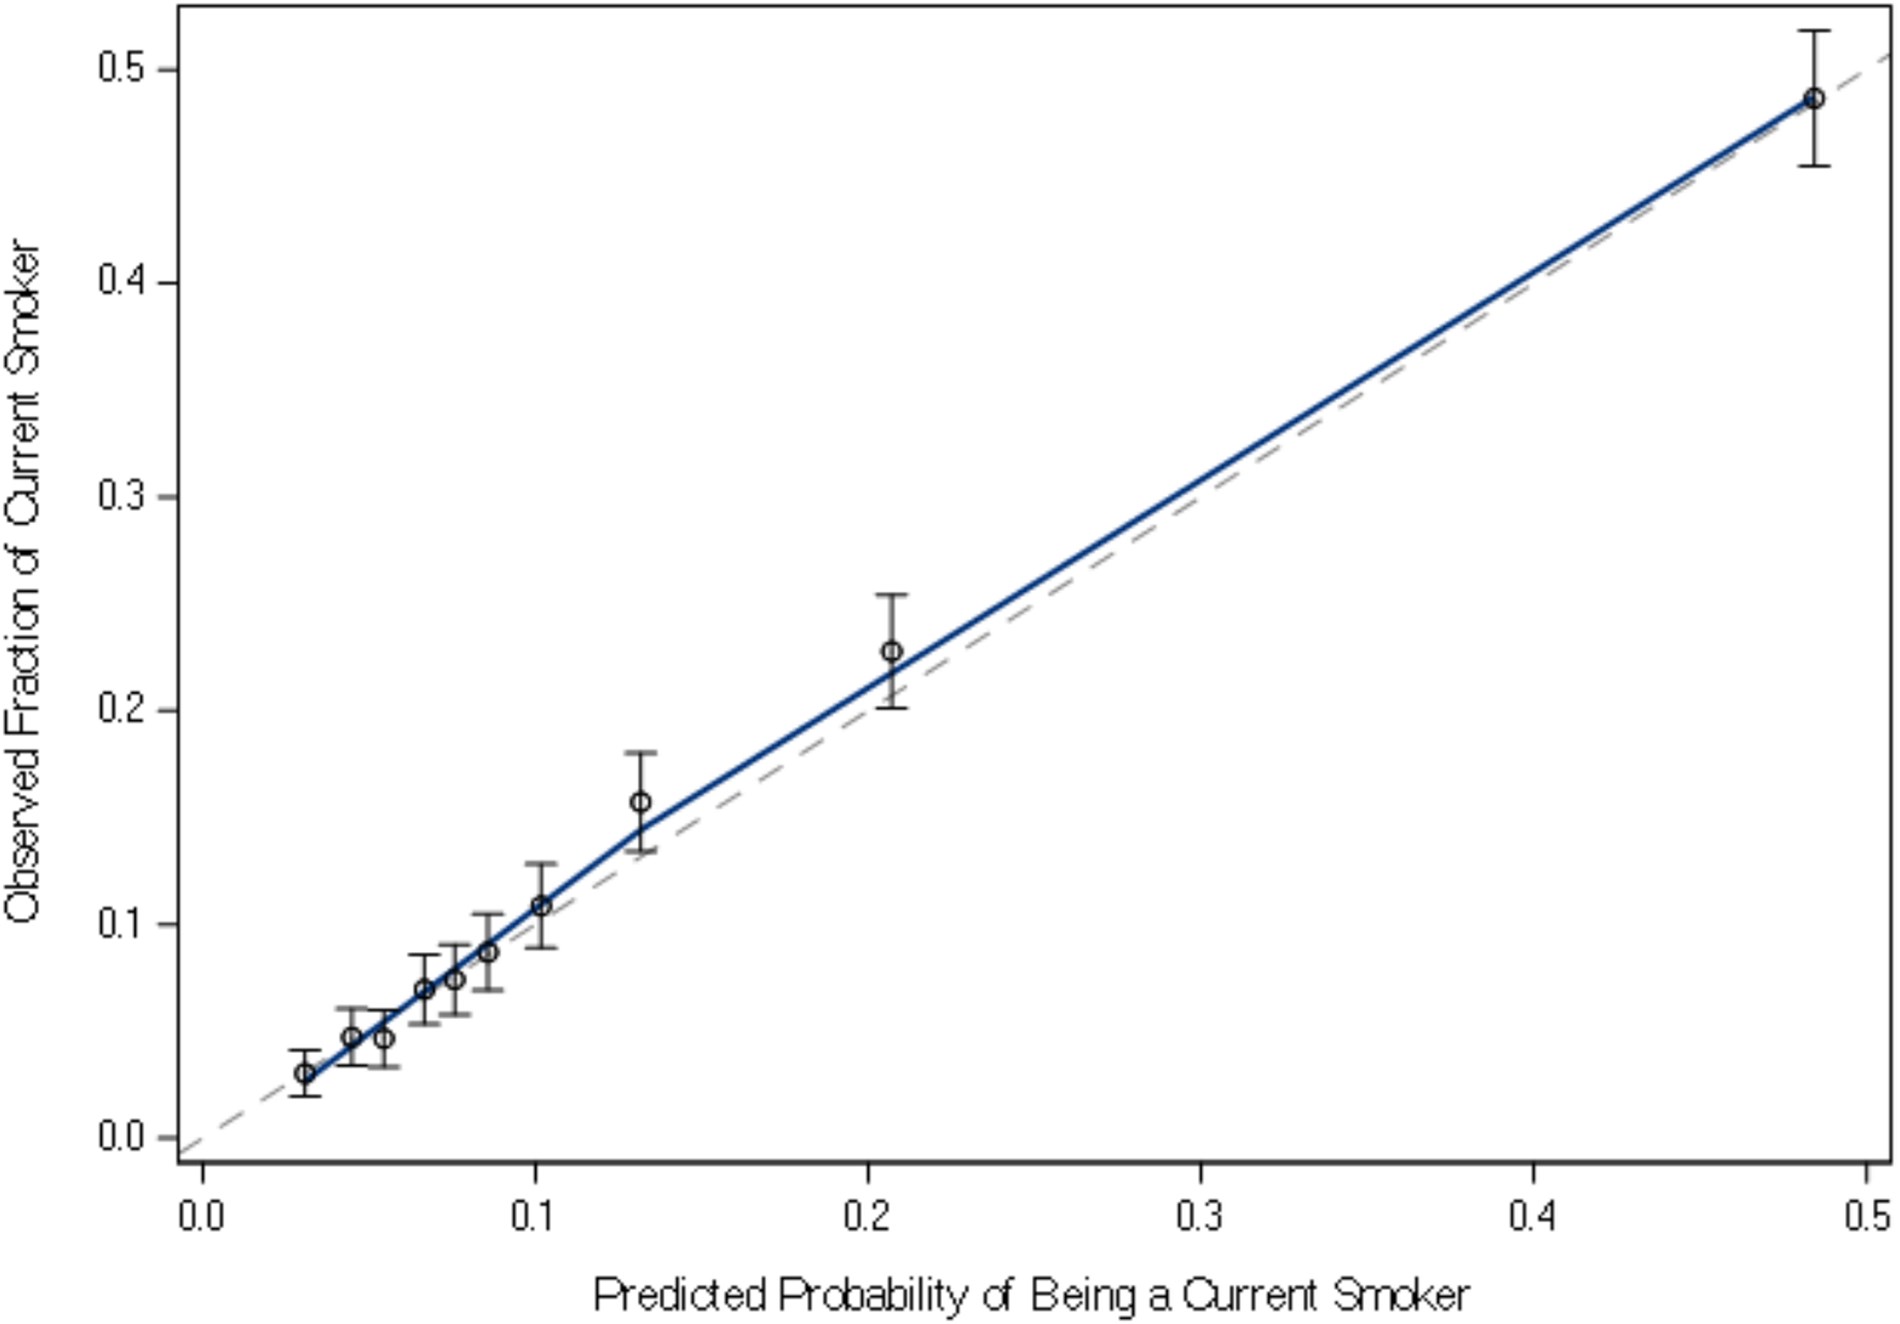
Figure 3
Calibration plot by decile for the test set. The dashed line represents the predicted linear function. The solid line represents the fitted loess curve. Each circle represents the mean predicted probability for each decile, plotted with 95% confidence interval error bars.