New Model Shows Importance of Local Features in COVID-19 Spread
As pressures mount in many areas of the U.S. to reopen businesses that were shuttered to prevent COVID-19 spread, a pressing question is, at what level of government should these judgments be made? A new model of disease transmission shows that city- and county-level characteristics have significant impact. Variations in population density and commuter traffic, in temperature over time, and, most important, in how social distancing is actually being practiced, as shown in cell-phone data, were shown to influence how the epidemic is playing out now and may progress in future. As a complement to national models, these preliminary findings may help local officials time their decisions.
Researchers in the DBEI and CCEB and at the PolicyLab at Children’s Hospital of Philadelphia (CHOP) used their model to project how incidents of the disease may crop up over the next few months—specifically, what could happen if communities are halfway back to normal activity in mid-May—given each county’s characteristics. “We see some overall trends: strict social distancing policies, low population density, and, to a lesser extent, warming weather help slow the spread of the virus,” said Gregory Tasian, MD, MSc, MSCE, a specialist in time-series studies. “But our main point is, we see important differences from one small area to another. We need to track these so that we can loosen restrictions where appropriate—perhaps in more rural areas—and be cautious where resurgence seems likely.”
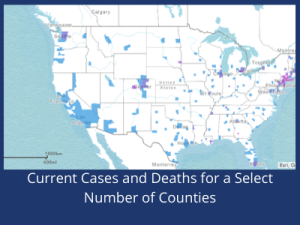
Current national models offer projections for large areas, using a fixed formula to calculate the expected number of people who would get the virus from each infected person. The new model, known as COVID-Lab: Mapping COVID-19 in Your Community, draws on data from 260 counties, some in every state, that show a minimum threshold of disease activity. It draws on sources including The New York Times, USAFACTS, the American Community Survey and the Behavioral Risk Factor Surveillance System, as well as National Oceanic and Atmospheric Administration Local Climatological Data. The model represents 58 percent of the total U.S. population, and its interactive maps are publicly available on the CHOP site.
In each county it measures social distancing, the most influential factor, as the percentage of change in visits to nonessential businesses.
“Our model not only monitors county-level data from the last two months, it also predicts the risk for resurgent transmission, which could be helpful in predicting future outbreaks,” said Jing Huang, PhD. “Our approach is unique in that we model the dynamics of disease transmission using real-time reproduction numbers, identify aspects that vary over time, and consider city-level characteristics that affect Covid-19 transmission,” she added.
The researchers view the model as a practical tool. “We hope to help city leaders and public health officials build more targeted strategies for reopening communities that consider not only the strain on our health care systems, but also how to deploy strategies such as masking and workplace safety regulations to maintain some distancing as people leave the confines of their homes,” said David Rubin, MD, MSCE, director of PolicyLab and a professor of Pediatrics in the Perelman School of Medicine.